![CBF2D5DD-379E-4240-B922-9B02697B7958-2.png]](https://kb.smooth.tech/hs-fs/hubfs/CBF2D5DD-379E-4240-B922-9B02697B7958-2.png?height=50&name=CBF2D5DD-379E-4240-B922-9B02697B7958-2.png)
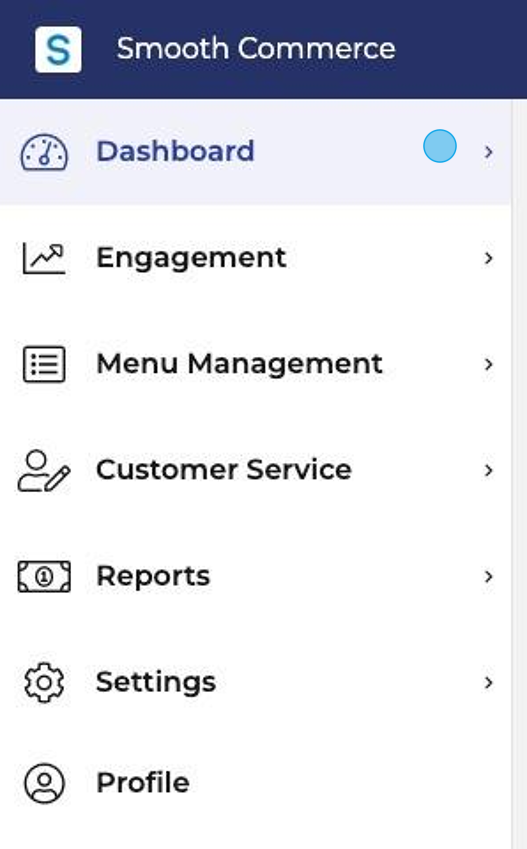
In the merchant portal, navigate to Dashboard.
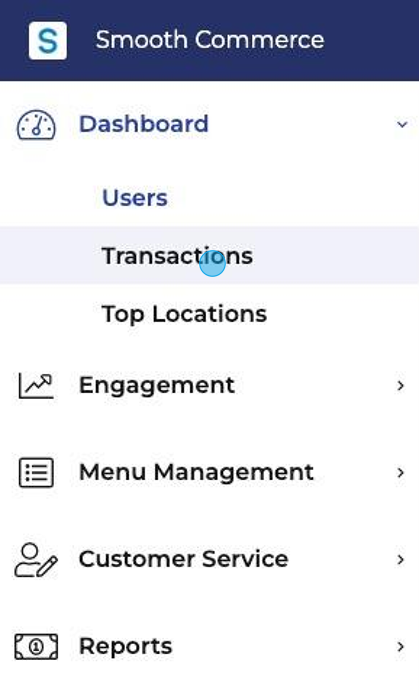
Select the dashboard titled “Transactions”.
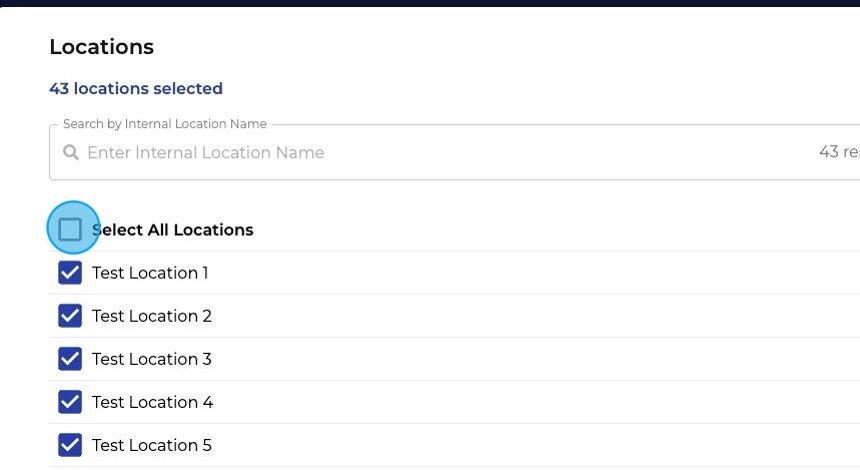
Within this dashboard, you can select the location you want to examine - either all your locations or a specific location.
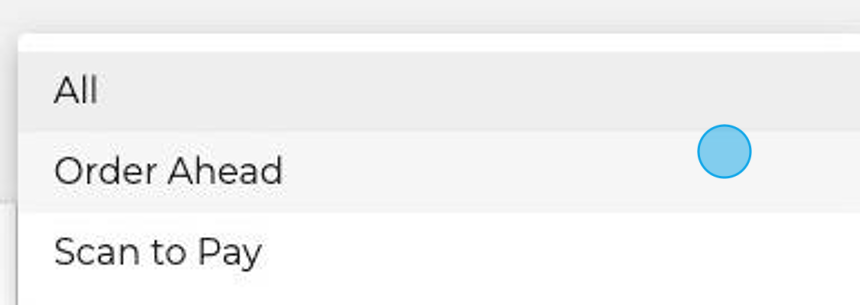
Choose the order type: all, order ahead or scan to pay.
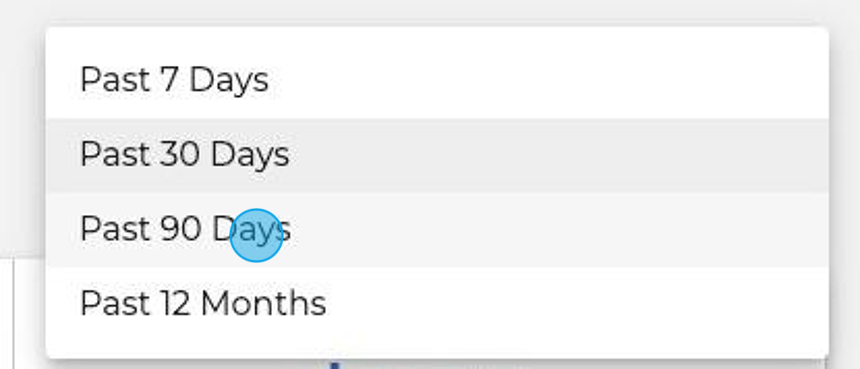
Select the time period you want to view your data.
This dashboard gives you two sets of information.
Summarized Data:
- Total Transactions: The total number of transactions.
- First Time Transactions: The total number of transactions for all users who made their first purchase.
- Amount of Sales: The total revenue generated.
- Average Transaction: The average revenue generated given all transactions.
Graphs:
- Transactions: Compare the transactions against the current and previous period. This data shows which months had the highest transactions and may indicate whether you had an enticing promotion during a specific month. The current period will be based on your selection under “Time Period”, while the previous period is measured against the time period you've selected. For example, if you choose "past 7 days" as your time period, the previous period would be seven days prior to that.
- Sales: You can also compare sales between the current and previous period. This will show you which months had the highest amount of sales and highlights the total sales amount. The current period will be based on your selection under “Time Period”, while the previous period is measured against the time period you've selected. For example, if you choose "past 30 days" as your time period, the previous period would be thirty days prior to that.
- Transactions Per Hour: Transactions per hour shows which hours yielded the highest amount of transactions during the past week.
- Order Type: Compare which payment types your users are using - either order ahead or scan to pay, if applicable.
Check out this tutorial video: